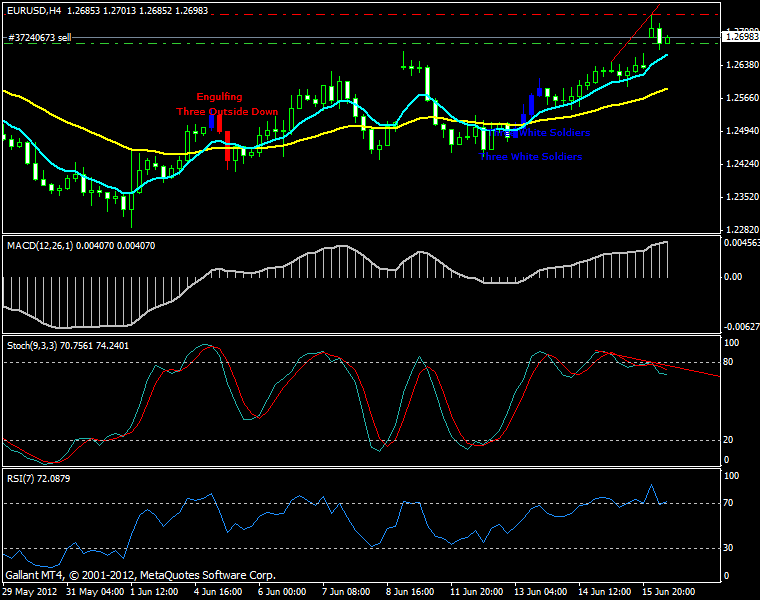
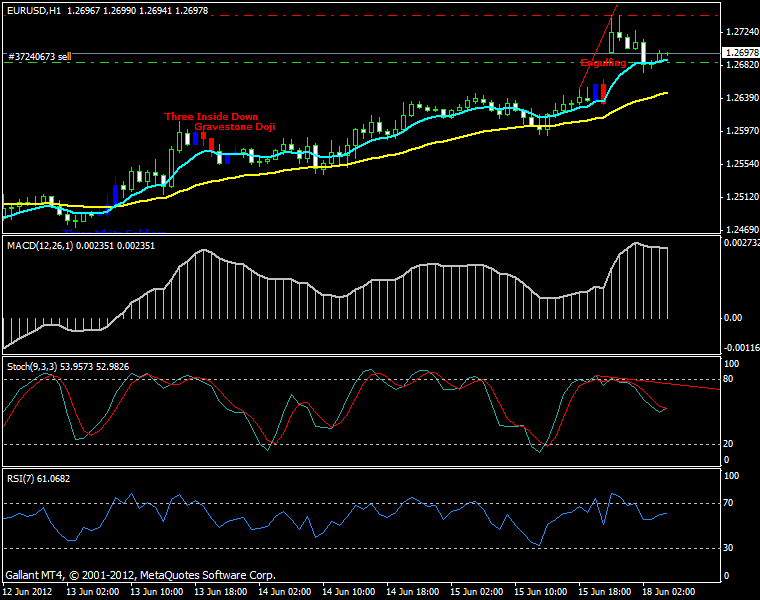
EUR/USD H4 Timeframe Showing Regular Bearish Divergence For The Week 18th June 2012!
on June 18th, 2012 at 4:38 amEUR/USD made a strong rally last week despite predictions made by many analysts that there will be only a weak rally and then heavy selling on Friday just before the Greek Elections. Greek Elections are over. You can read the detailed EUR/USD outlook for June 18-22 at FOREXPROS. Watch the video below that gives the EUR/USD outlook for this week. EUR/USD opened today on 18th June 2012 with a gap up of around 58 pips.
Last week EUR/USD was buy but this week it seems it is sell. First let’s take a detailed look at EUR/USD H1 chart below. The market opened with a gap up and the very first candlestick pattern formed was a shooting star which is a bearish reversal pattern. EUR/USD has been in an uptrend from 13th June last week. But it seems that this uptrend is now over with the appearance of a Regular Bearish Divergence Pattern. As you can see below the Stochastic is showing Regular Bearish Divergence meaning EUR/USD pair will be heading down for the next few days.

Now, if you take a detailed look at the EUR/USD H4 chart below, you will find a very nice regular bearish divergence pattern appearing which is further confirming the appearance of the bearish divergence pattern on H1 timeframe. Appearance of Regular Bearish Divergence on H4 timeframe is a strong signal much stronger than the appearance of the Regular Bearish Divergence on H1 timeframe.

Regular Bearish Divergence on H4 means that downtrend will last for a few days. You will need to check the D1 timeframe in the next few days. If a Regular Bearish Divergence Signal develops on the Daily timeframe, it will mean that the downtrend in EUR/USD pair is confirmed and it might last for a few weeks. If there is not Regular Bearish Divergence rather there is hidden divergence it will mean that the downtrend on H4 and H1 timeframe was a retracement on D1 timeframe.
As said above the market opened with a gap up of 58 pips and the first candlestick is a shooting star and if you connect the higher highs on the price chart, you will find Stochastic making a lower high meaning there is regular bearish divergence. What this means is that EUR/USD pair will be in a downtrend for the next few days. If you go short at this moment you can easily make something like 200-300 pips in the next few days before the week ends. If you spot bullish regular divergence forming on either H1 or H4 timeframe, simply close the trade and take profit. That’s it!